
Elephant vs Donkey — 2020 Presidential Election Prediction
- Link to Github
- Code and Notebooks
-
Group Members: Annan CHEN, Tianqi SHEN, Bingsu MO, Xiaoya XU
- Important Notes:
- Data we scrapped and used for presentation were until 11/21/2019 so it might be slightly different from the data when running the notebook again, which is constantly updating.
- This prediction was made pre-covid AND majorly based on US Census Data. We might not be able to guarantee the accuracy of final result in 2020.
- “The only constant in life is change” -Heraclitus.
Project Overview
The project, by processing and analyzing census and twitter data, attempted to predict whether Mr. Trump could win the 2020 President Election. The project is interesting considering the three following aspects:
-
The dataset we used in machine learning is pretty comprehensive. For each congressional district, it contains variables regarding employment (unemployment rate, labor force, working agriculture etc.), race composition, education and health care level (health insurance coverage). We also add variables regarding macroeconomics (Gini coefficient) and election-related variables (turnout, previous vote). We are confident to say that we managed to take most of the variables that have an impact on the election results into account. Besides, various models and rigorous validation ensure the credibility of our results.
-
We also used twitter data and text mining to figure out how people feel about different candidates and how popular they are in twitter, which further completes the analysis. After all, the personal characteristics also have huge impact on election results.
-
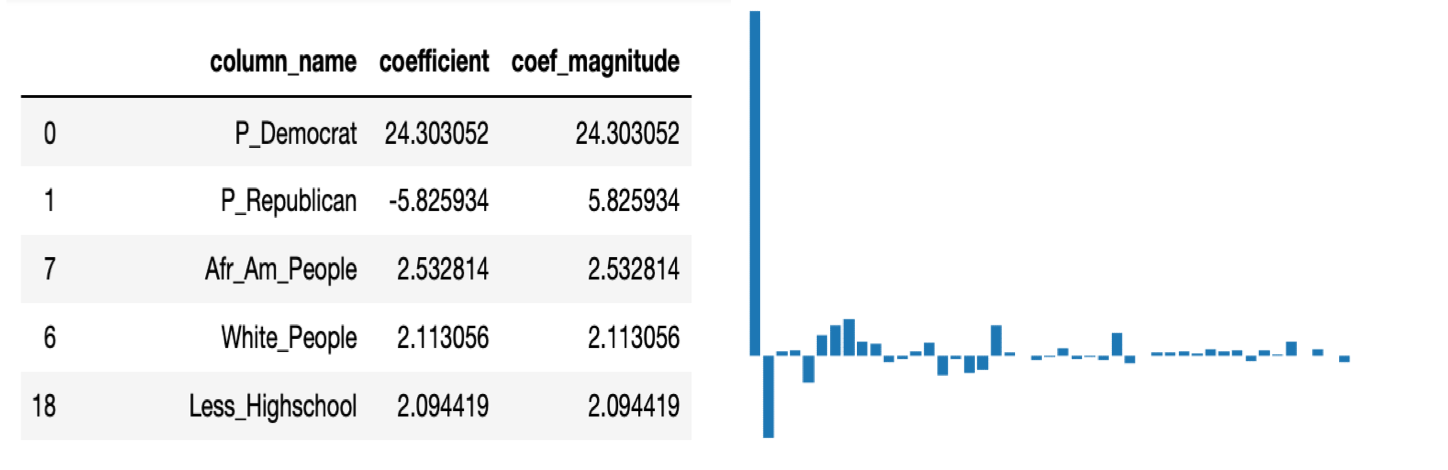
Aside from the prediction for 2020 president election, we also have interesting by products. For example, the feature importance in machine learning revealed which factors are the most influential ones when it comes to president election. Besides, we also figured out who is the most competitive candidate in Democrat. Both of these can be very helpful in campaign planning. We also figured out the biggest concern of each candidate through wordcloud of their twitter. The feature importance is shown in Graph below.
Part 1: President election result prediction through machine learning
Data Source
Through API and web scrapping, we derived data from United States Census Bureau and American Community Survey. The dataset contains three years data (2012, 2016 and 2018) for 435 congressional districts. As we mentioned before, this combined dataset contains data regarding all the important aspects, like employment, race composition, election-related variables etc. We also derived the president election result of 2012 and 2016, which served as dependent variable in our following analysis.
Data Scraping and Collection
We used census API to collect congressional district data from United State Census. We need specific codes for different variables in each year, for example, the population for each CD is “B01003_001E” for 2009. Also, we need to transform the dictionary into pandas’ DataFrame. Except for the demographical variables like population and races, we also include factors like healthcare, economic, educational, etc. For each year the code corresponding to each variables might vary differently, therefore for different year we wrote different function(like get_data_2009, get_data_2011). Similar method is used for state-level attribute.
Data Preprocessing and Visualization
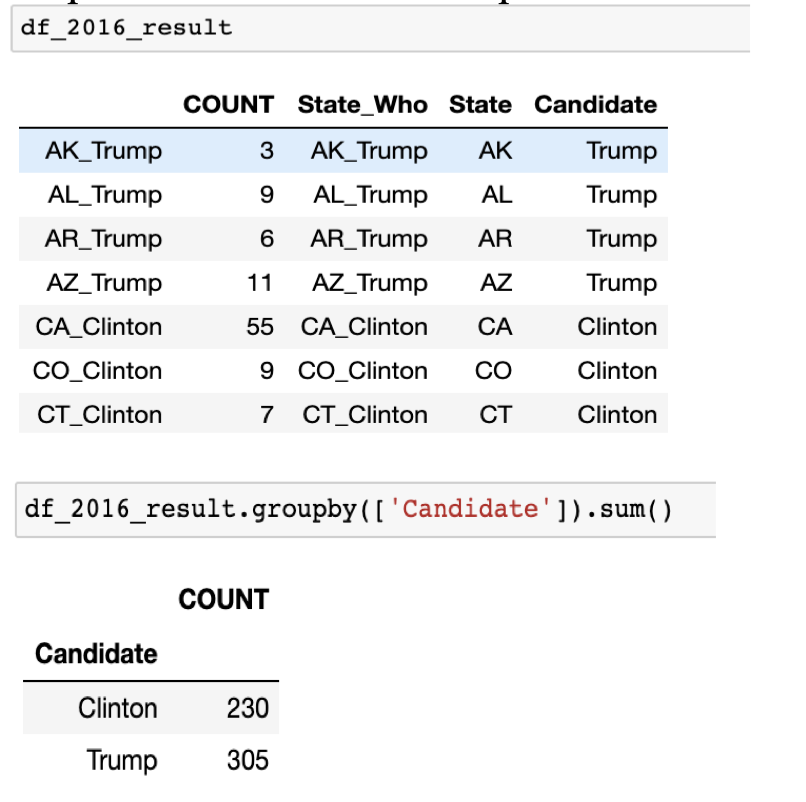
After we get the census data, turnout rate and previous election result from the dataset, we need to combine them together to get an aggregated DataFrame for each year. Therefore we use merge function on the unique key “CD-ID” for every congressional district. The election result we have for each CD is percentage for Democrat and Republican, but to calculate the final winner for the state, we need to sum up all the real-ticket number for each CD in a state because of the rule of “Winner takes all”. Therefore we create another columns to store the number of ticket for this district. Additionally, we wrote the function “who_win” to store the winner for each state - it will be the same for all CDs in a particular state. This result is stored in “df_year_result” and we can calculate the number and get the final president for the U.S. for different election year using groupby function, as shown in the following graph. Particularly, because of the 2010 Census, the 2012’s result needs some adjustment.
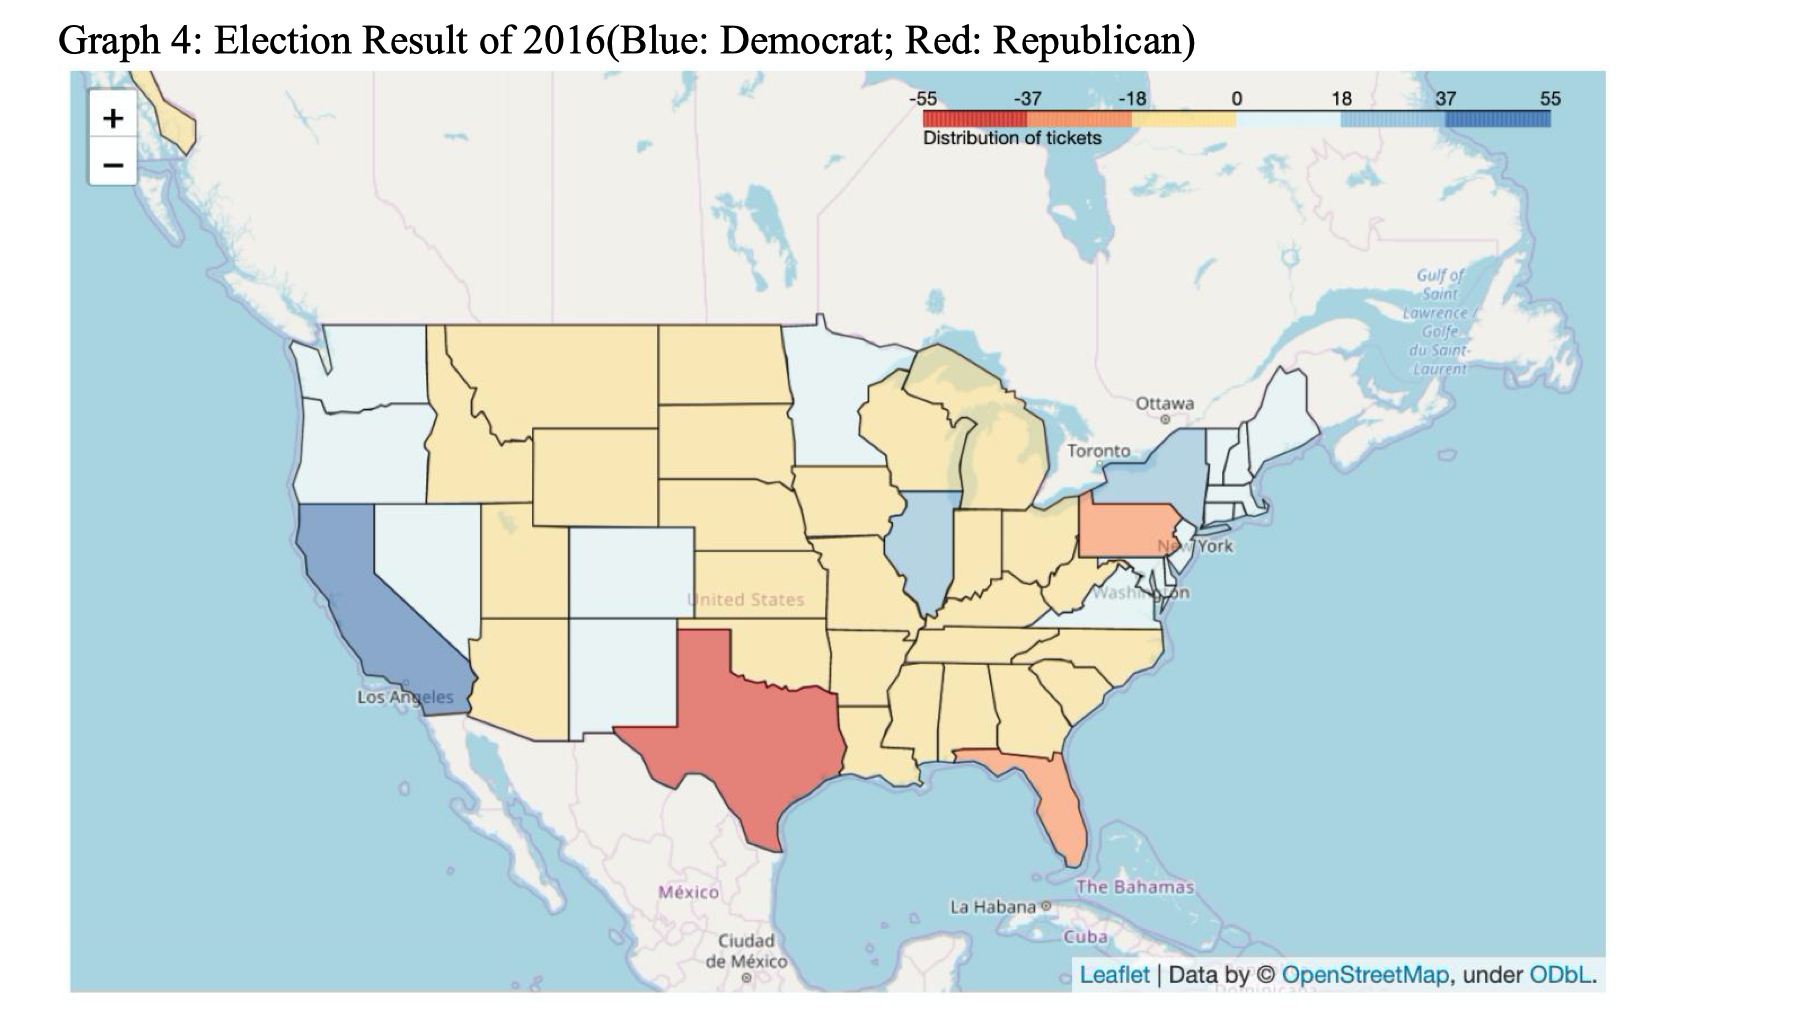
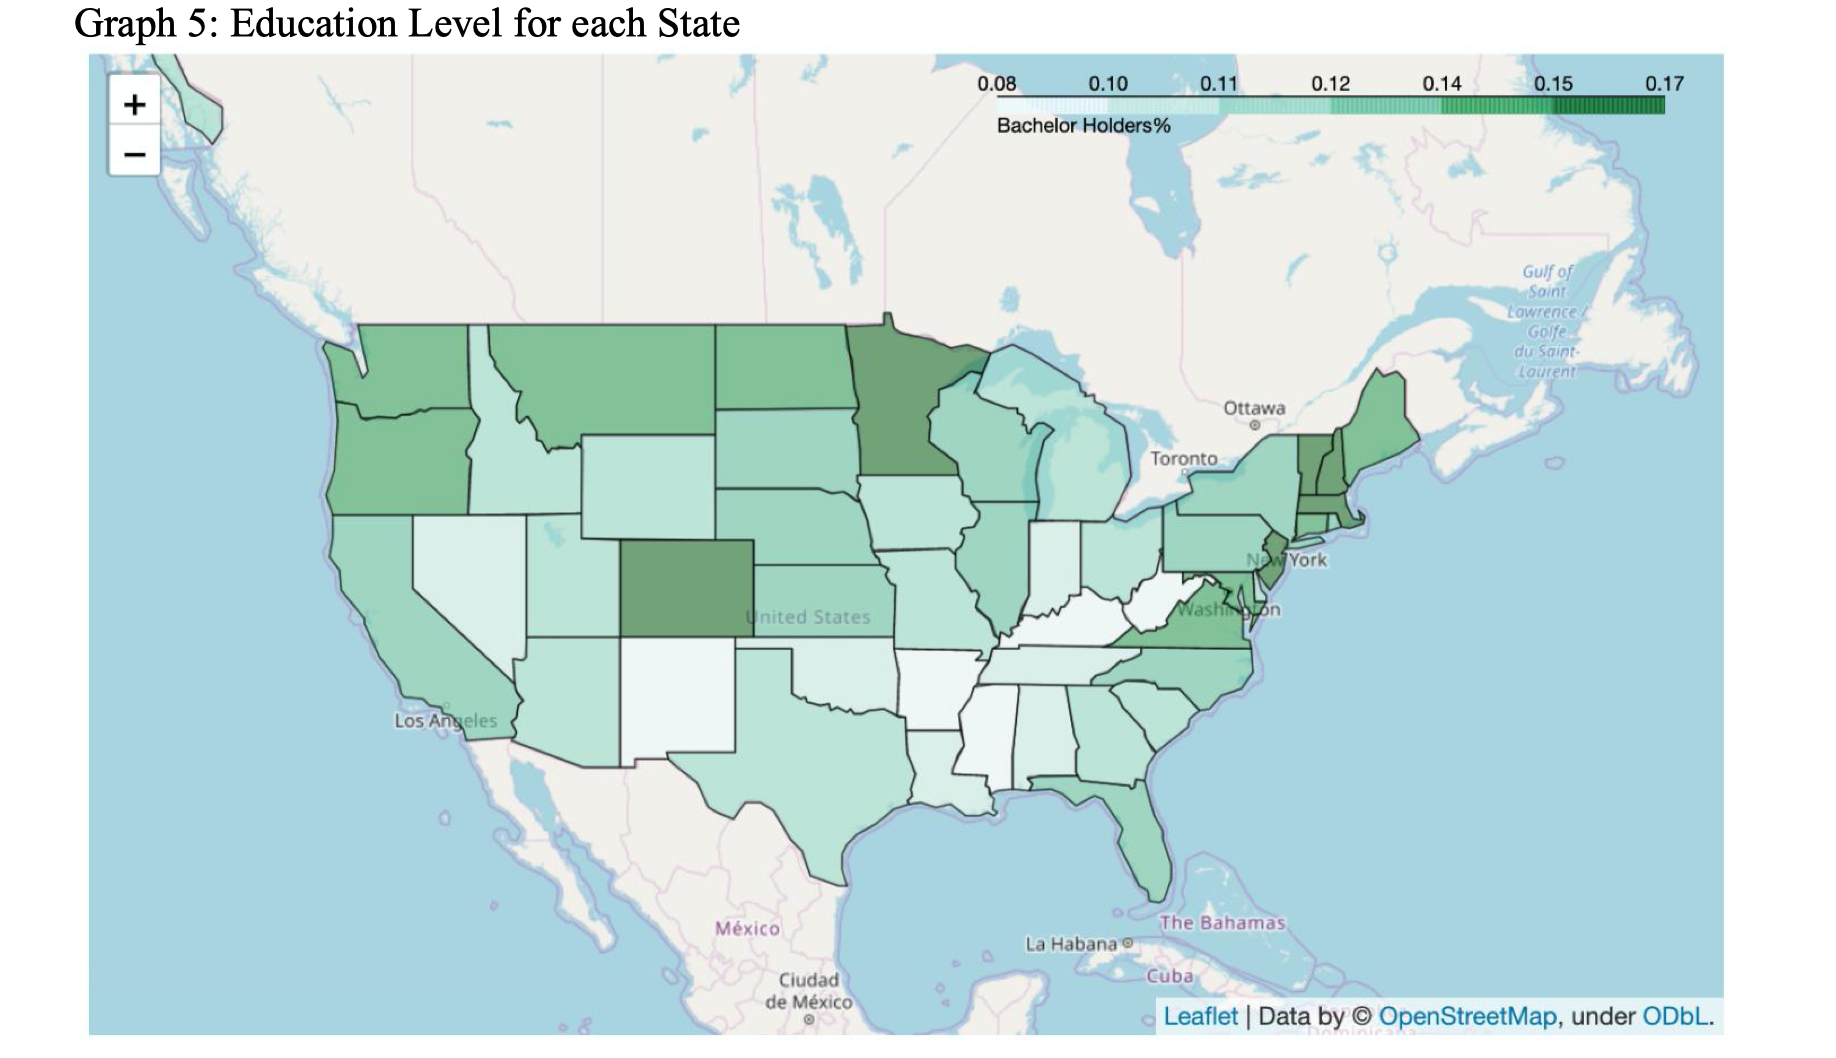
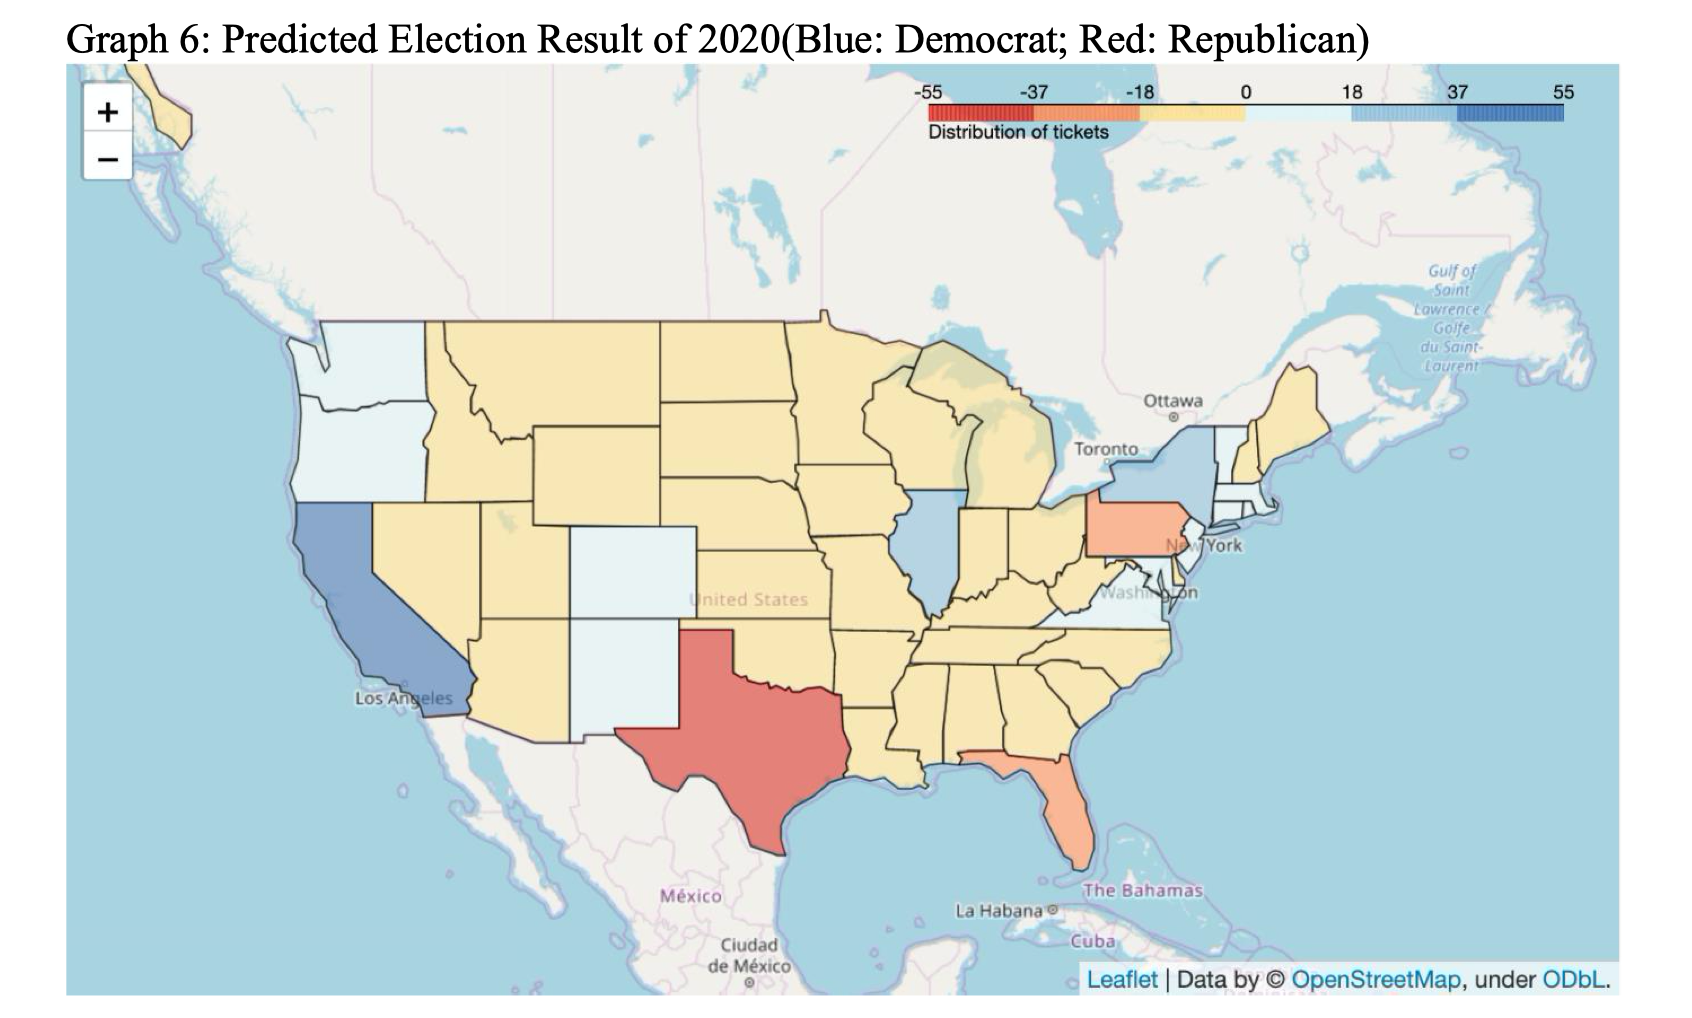
To better understand the result and other information of each state before going into modeling part, we use folium to visualize the election result by each state and other features we presumed important, such as education, unemployment, income, etc, as shown in Graph 4 and Graph 5. The visualization is used also after the machine learning prediction of 2020 election result, as shown in Graph 6, which demonstrates the win of Republican in a straightforward way.
Feature Engineering and Modeling
For data we will be using in modeling, there are 423 rows for 2012, 435 rows for 2016, and 435 rows for 2018 (with only independent variables since we want to predict the dependent variable). Our methodology is to treat 2012 and 2016 equally, as if they were from different congressional district even if they are the same ones. In this case we assume that elections results are determined fully by the very immediate past/present. Different models will be compared and the best one selected. Most of the effort afterwards will be spent on validating the effectiveness of using cross validation as an effective proxy for forecasting error, and analysis on the usefulness of the model and where the inaccuracies of the model may exist.
Now we want to build up the initial baseline model. Firstly, we merge the 2012 and 2016 data together, making sure columns align. Then we drop certain columns related to states and use longitude and latitude data for every state to switch this only categorical variable into numbers. Next, we standardize the resulting dataset such that it’s means 0 and variance 1. Lastly, we fit several models on the resulting dataset, including support vector regression, gradient boosted tree, XG boost and lasso/ridge regression, then using cross validation for hyperparameter tuning. The algorithms we have used are shown in the graph below.
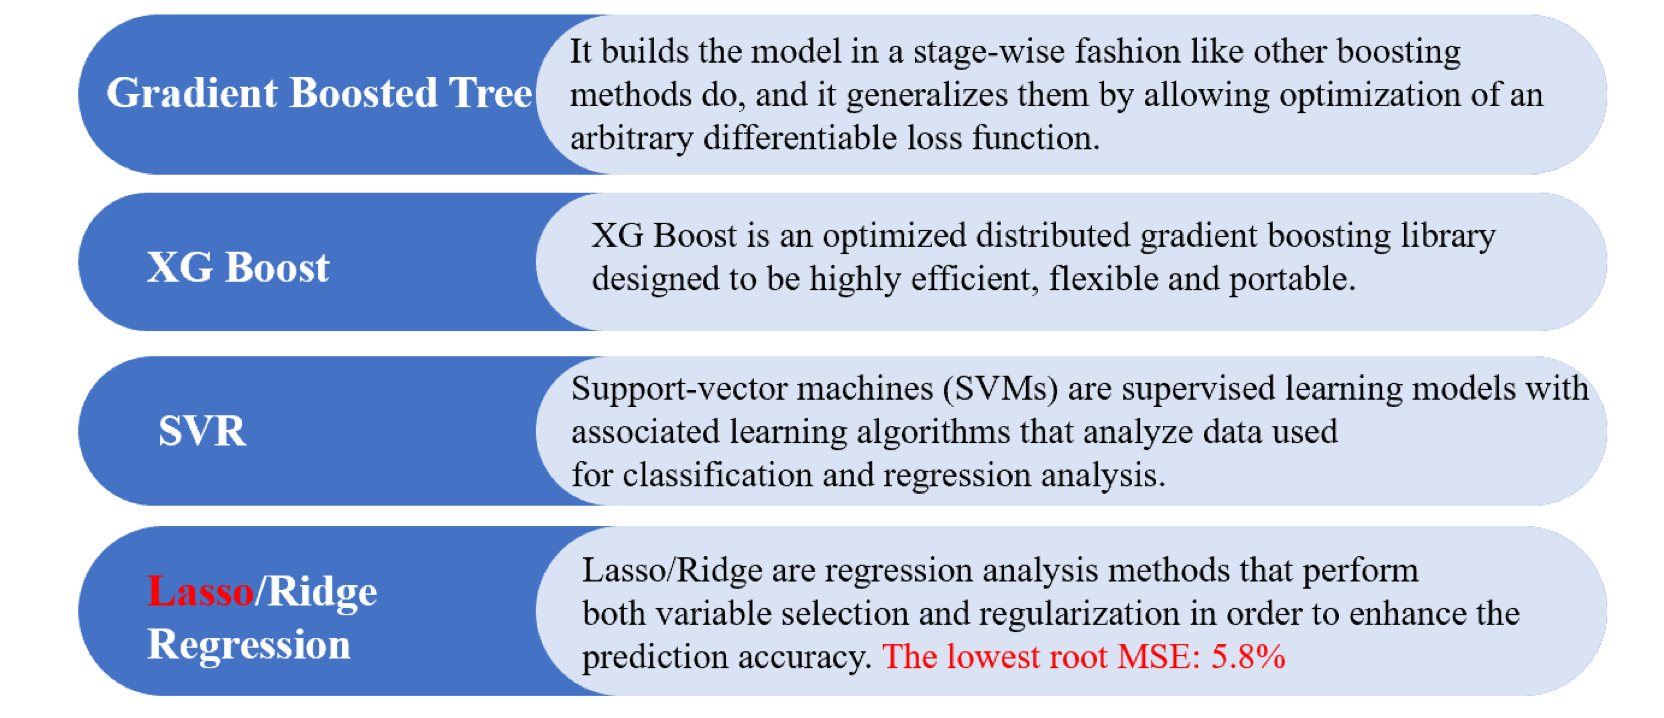
The baseline model results for lasso regression seem the most promising, since they seem to indicate that for each congressional district, the model would be on average reliable in determining a gap larger than 6% between the two parties. This would be for 90% of the congressional districts, and would therefore cover a majority of the states we have. However, there is no guarantee that cross validation error is a valid representation of test error in this case. Therefore, we need to check that cross validation error is a good proxy for forecasting error. First, we check that cross validation approach for error measurement is valid by doing the same approach on predicting 2016 voter composition. We find out that error rate is somewhat consistent, which is around 8.9%. As expected, the error to be slightly higher in this case since there are half as many data points. We can determine which party wins for every congressional district by looking at the sign of the predicted difference. Our model shows 93% of the validation set has the correct signs so as the winning party prediction at congressional district level. Through visualization, we can tell the rest of 7% that have not been predicted correctly are within 10%-15% percent away from their original values.
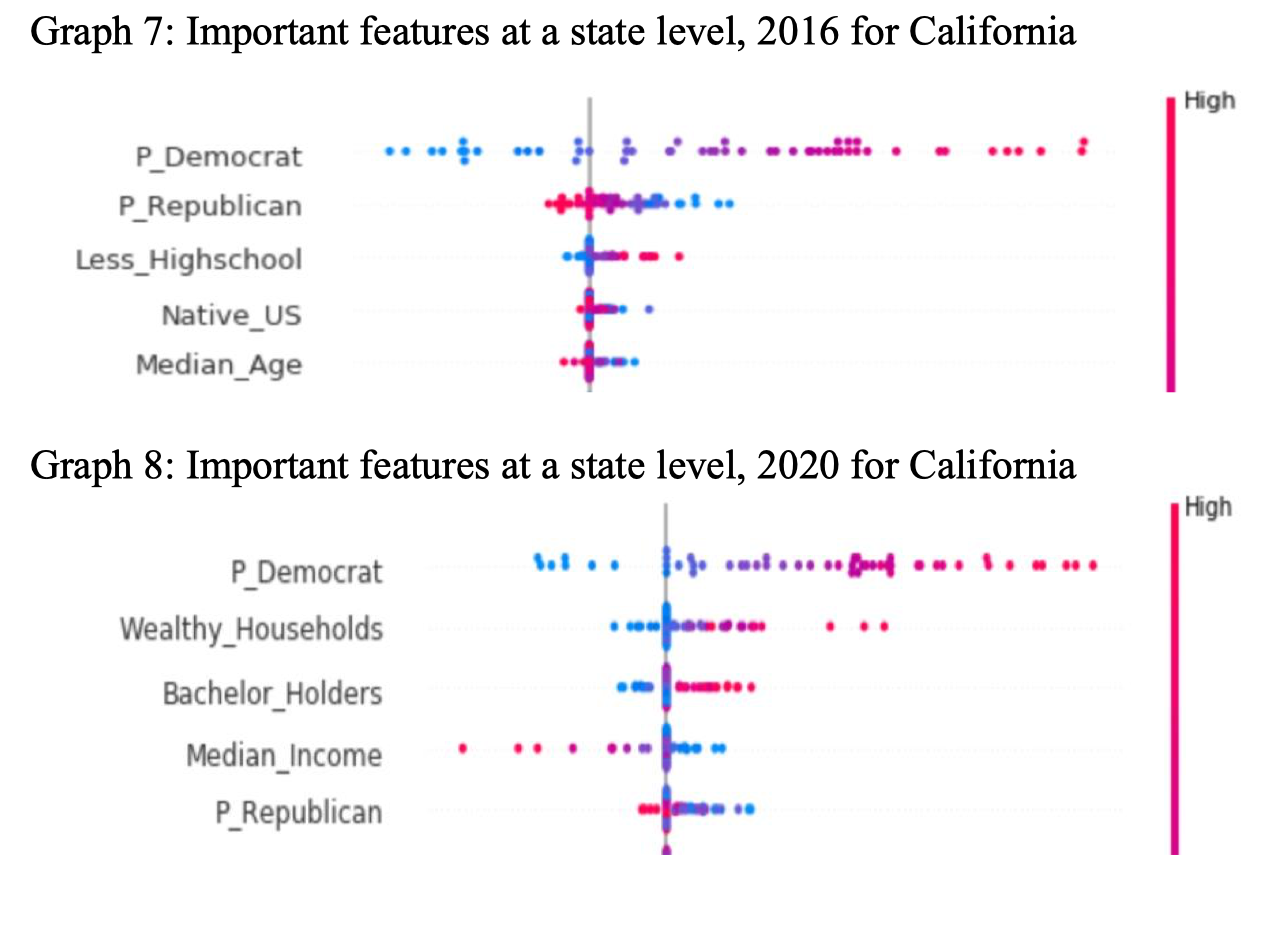
We see that for lasso regression, cross validation error for a sample in the past is a good proxy for forecasting test error for a model trained on the past dataset and then used to predict voting results for the future for each district. As further analysis, we can use the ranking of coefficient’s magnitude to determine how what the most important features are for our dataset in general. In order to understand the features at a lower level, we can use a GitHub library called SHAP to rank the importance of features for every district. We can also aggregate all the districts for a particular state and identity the important features at a state level, which is very important when considering about the reasons why a state changes their votes to another party for next election (we give an example of California for both 2016 and 2020, as shown in Graph 7 and Graph 8). Now we can use our model to predict the voting difference in percentage between two parties for every district for 2020 election.
At last, we predicted that Mr. Trump will win the 2020 president election.
Part 2: Prediction Verification: Text Mining on Twitter
In the previous modeling, we actually have an indispensable assumption, that is, we assumed that demographic features and indicators of life plays a decisive role in one’s political view, thus, we could use them to predict which party he would vote for. However, is this truly the fact? Or, more precisely, is this true fact for all? Probably not, because the characteristics of candidates also have huge impact on a person’s political preference. This brings us to the second part of the project: text mining for the candidates.
Data Source
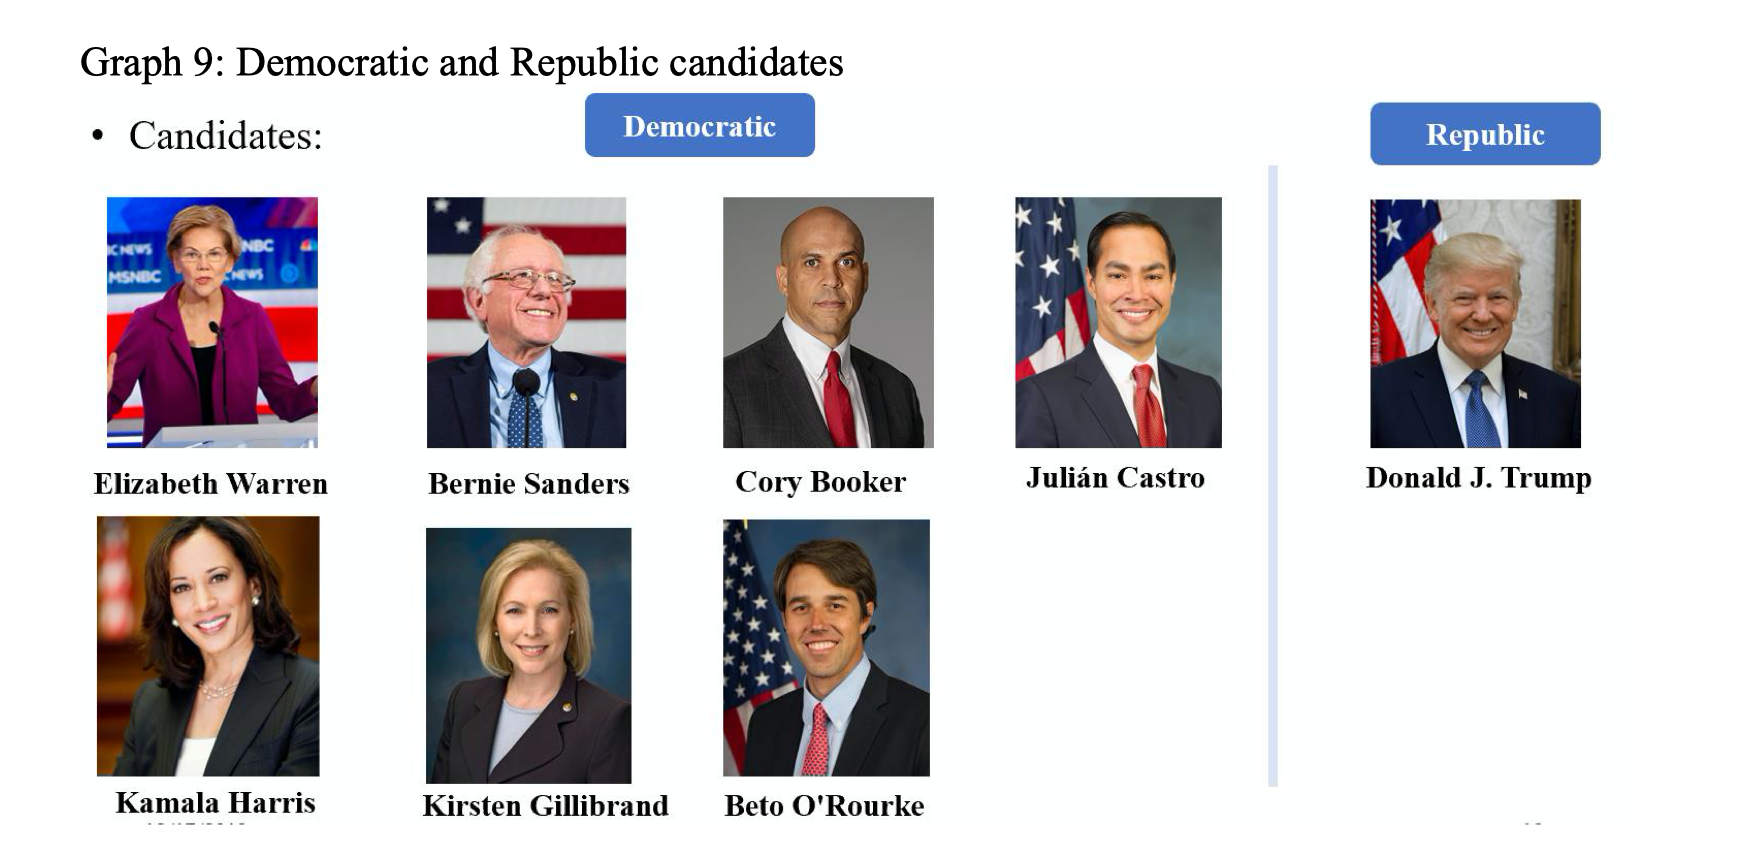
For Republican, we pick the current president, Donald Trump. For democratic, we pick seven most popular candidates. Candidates are demonstrated in Graph 9. Through twitter api, we derived two parts of data: each candidate’s twitter (3000 records each, due to the limit of twitter api), and recent twitters that mentions each candidate(also 3000 records each). We also find an interesting fact: for president Trump, due to the limited number of 3000 twitters, we could only reach the twitters in May 2019, which means, on average, Mr. president tweets 20 times a day.
Sentiment Analysis
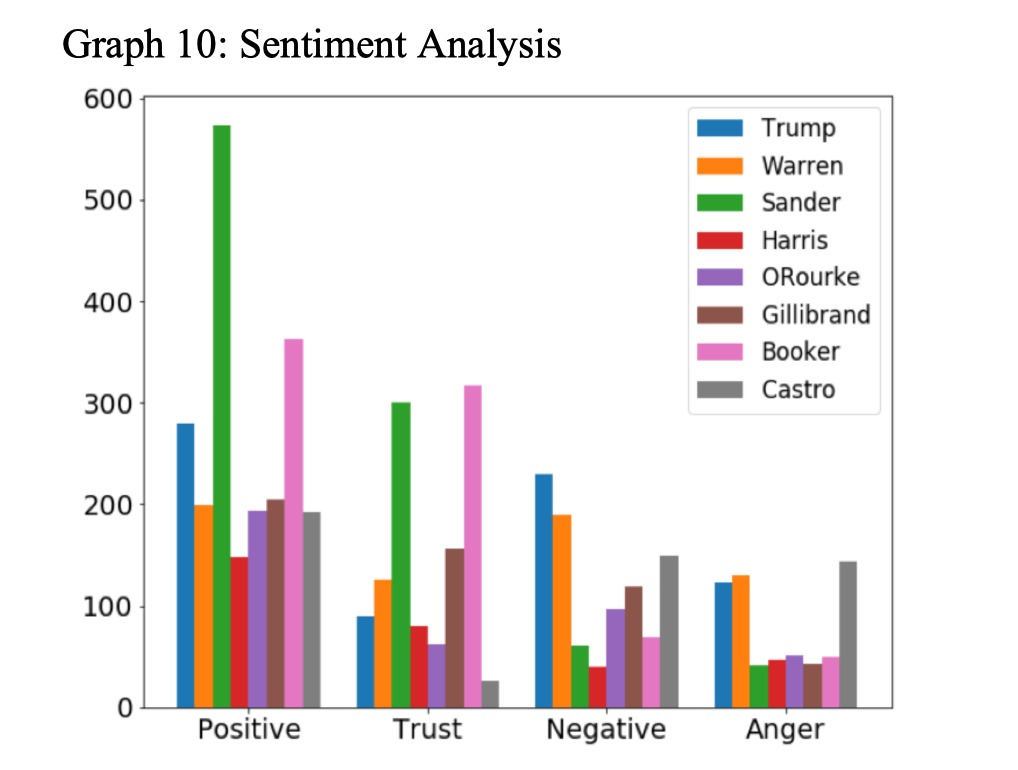
In order to figure out voters’ attitude towards different candidates, we conducted VADER sentiment analysis on tweets that mentioned each candidate. Among 8 emotions and 2 sentiments, we picked positive, negative, trust and anger. From the results, as demonstrated in Graph 10. we can see that Mr. Trump is currently facing problems in approval. The negative and anger score are relatively high while the scores for positive and trust are pretty low. The result also reveals the biggest competitor for Trump. That is Bernie Sanders and Cory Booker. They are both widely liked by twitter users.
Popularity Comparison
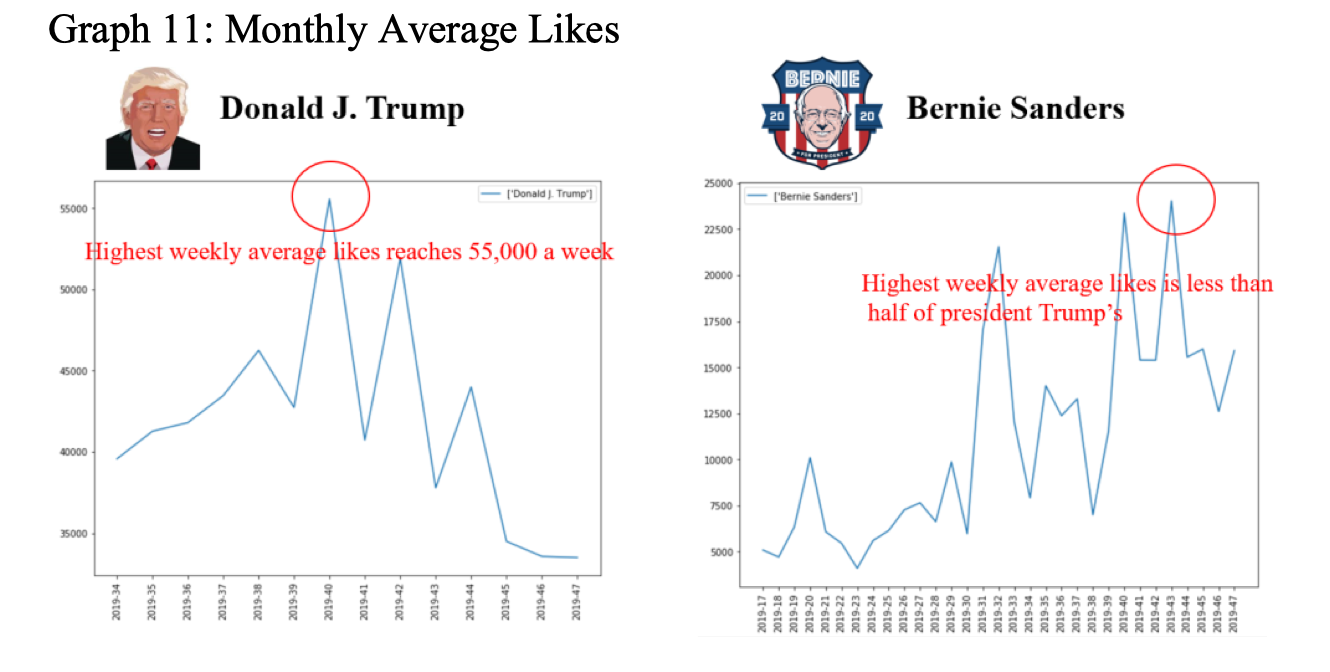
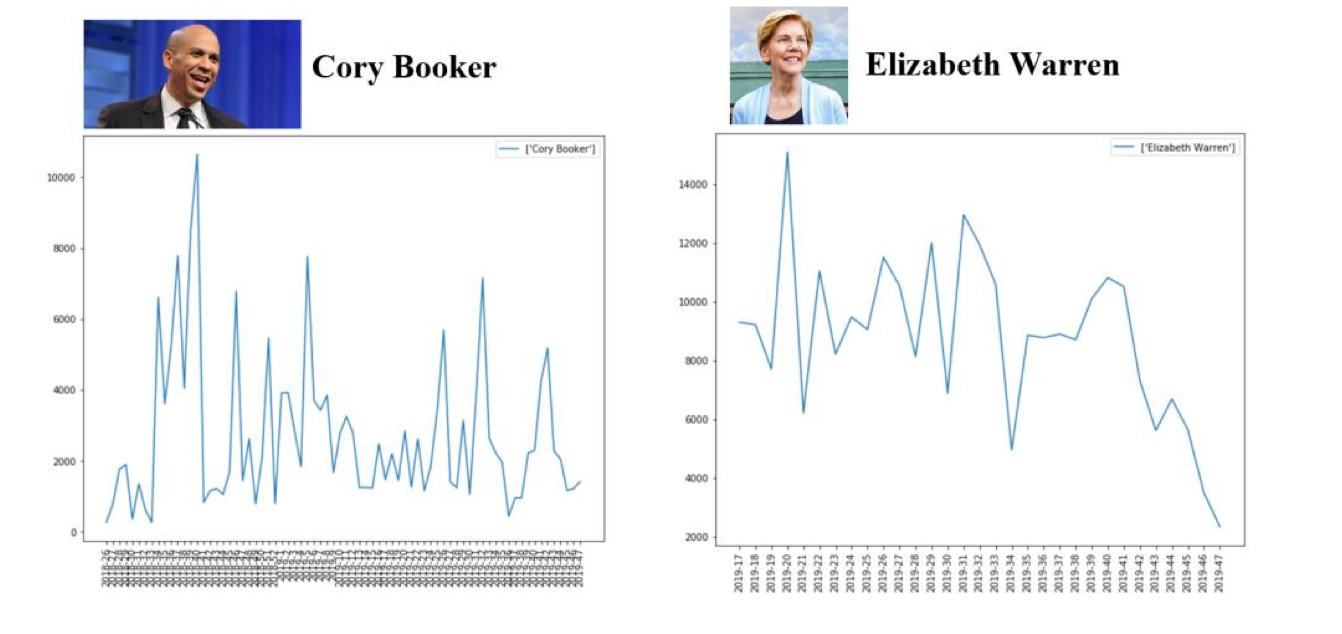
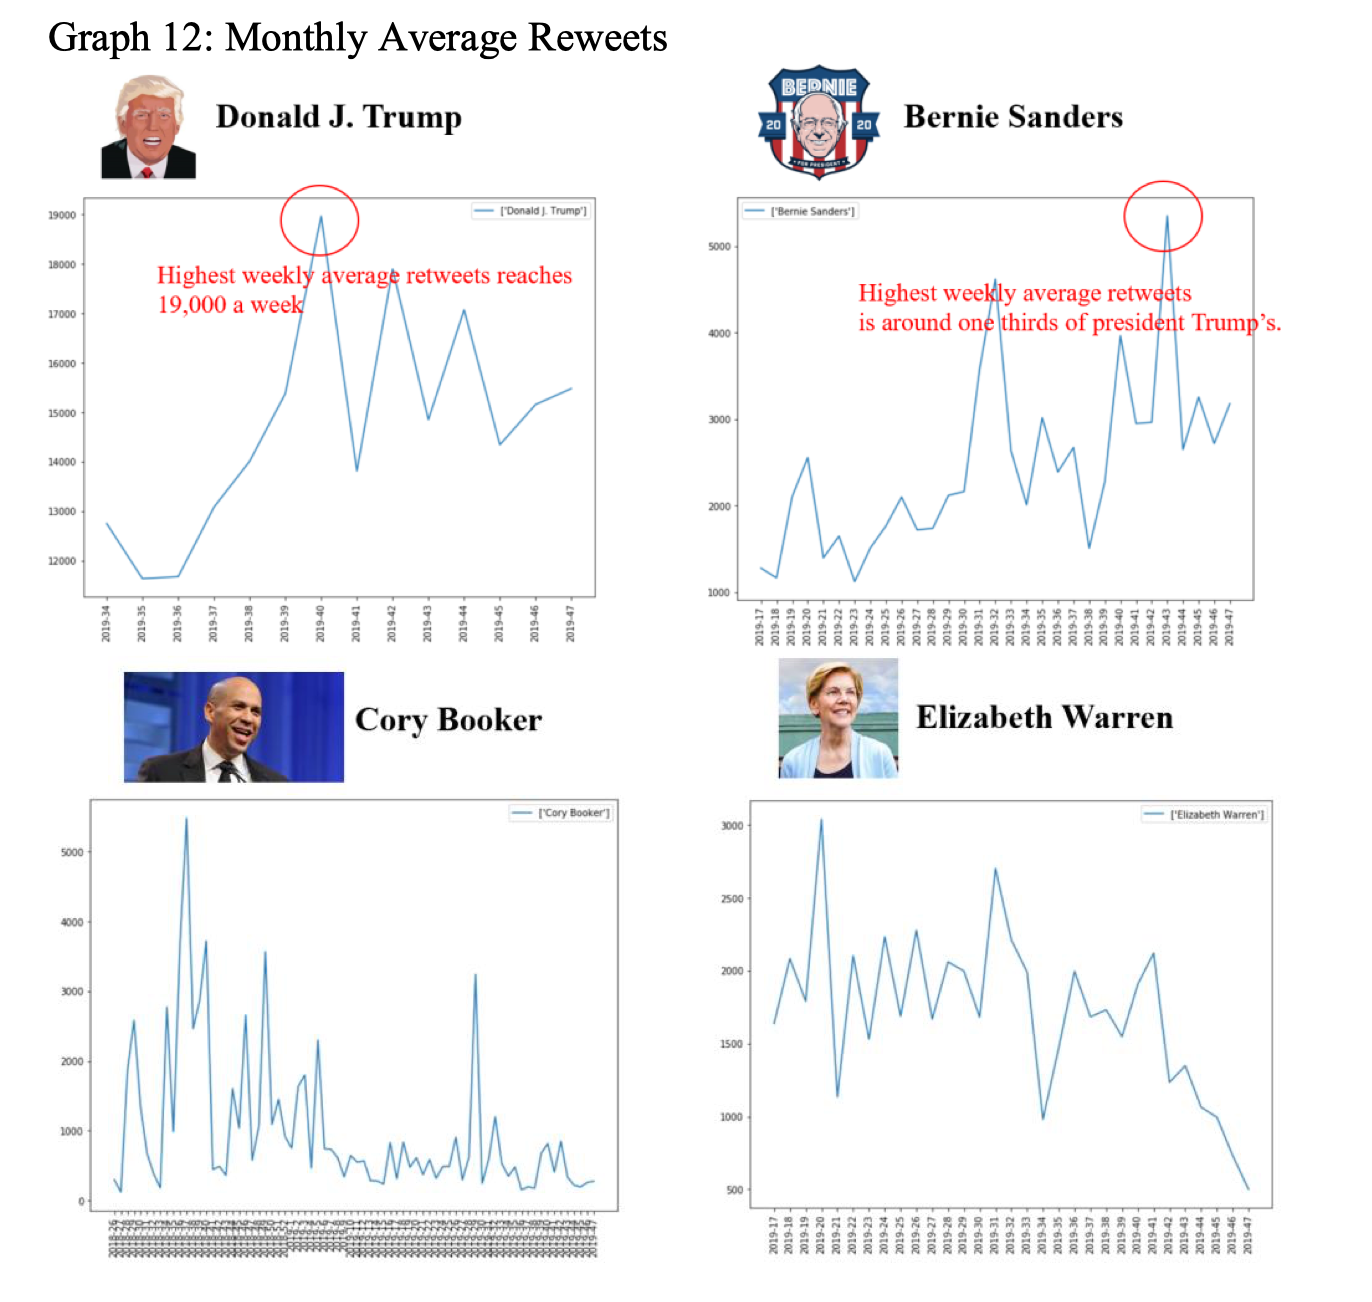
Aside from people’s general feelings toward candidates, we are also interested in how popular they are. Whether people care about them is also a game-changing factor in this era after all. Those who get the most attention also have the greatest potential to gain their votes. Therefore, we checked the average number of favorites and average number of retweets. From the results, as demonstrated in Graph 11 and Graph 12, we find that Trump is absolutely the most popular one on twitter. His has twice as many average favorites and retweets as Bernie Sanders, his biggest competitor.
Wordcloud for Each Candidate
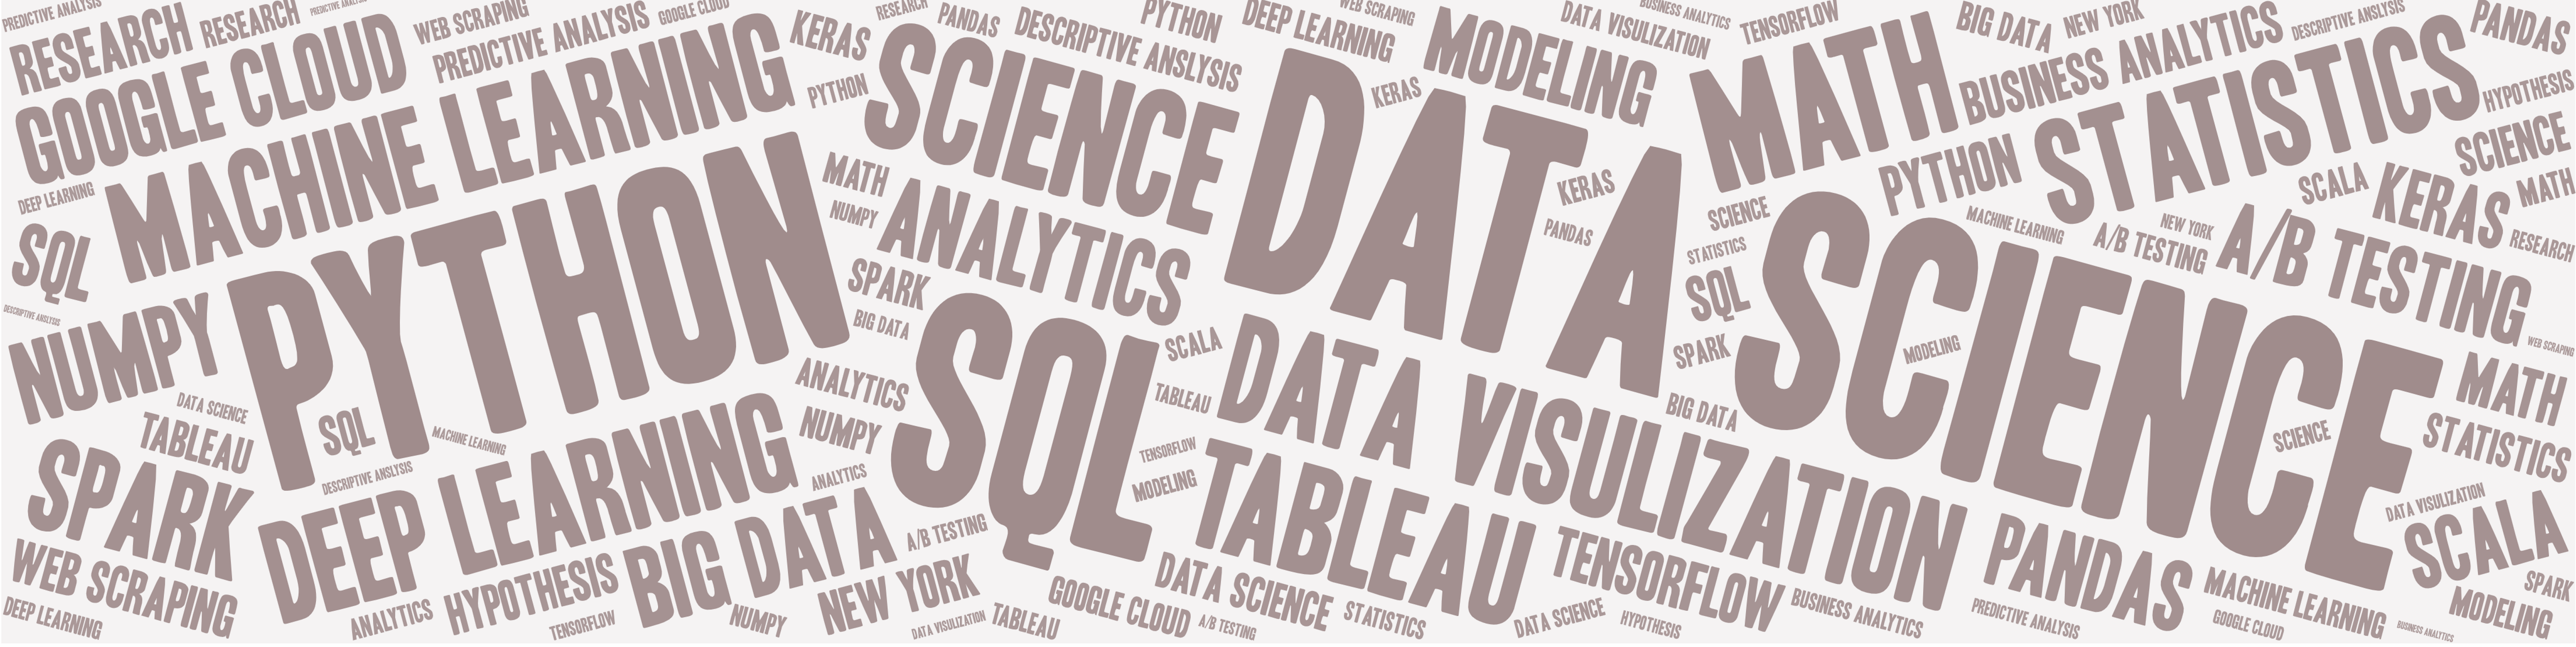
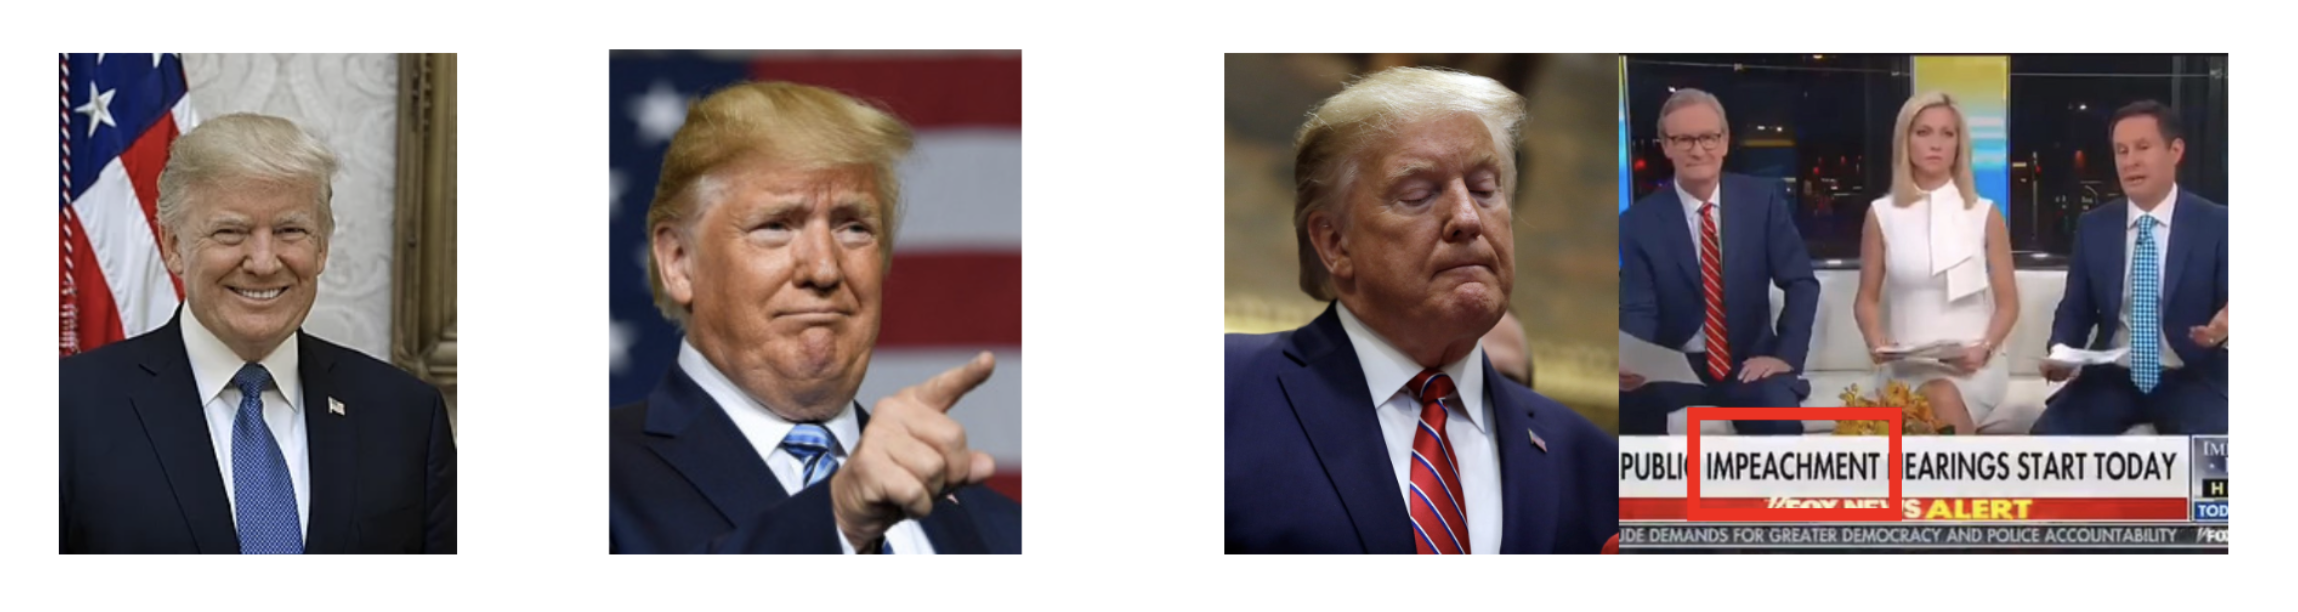
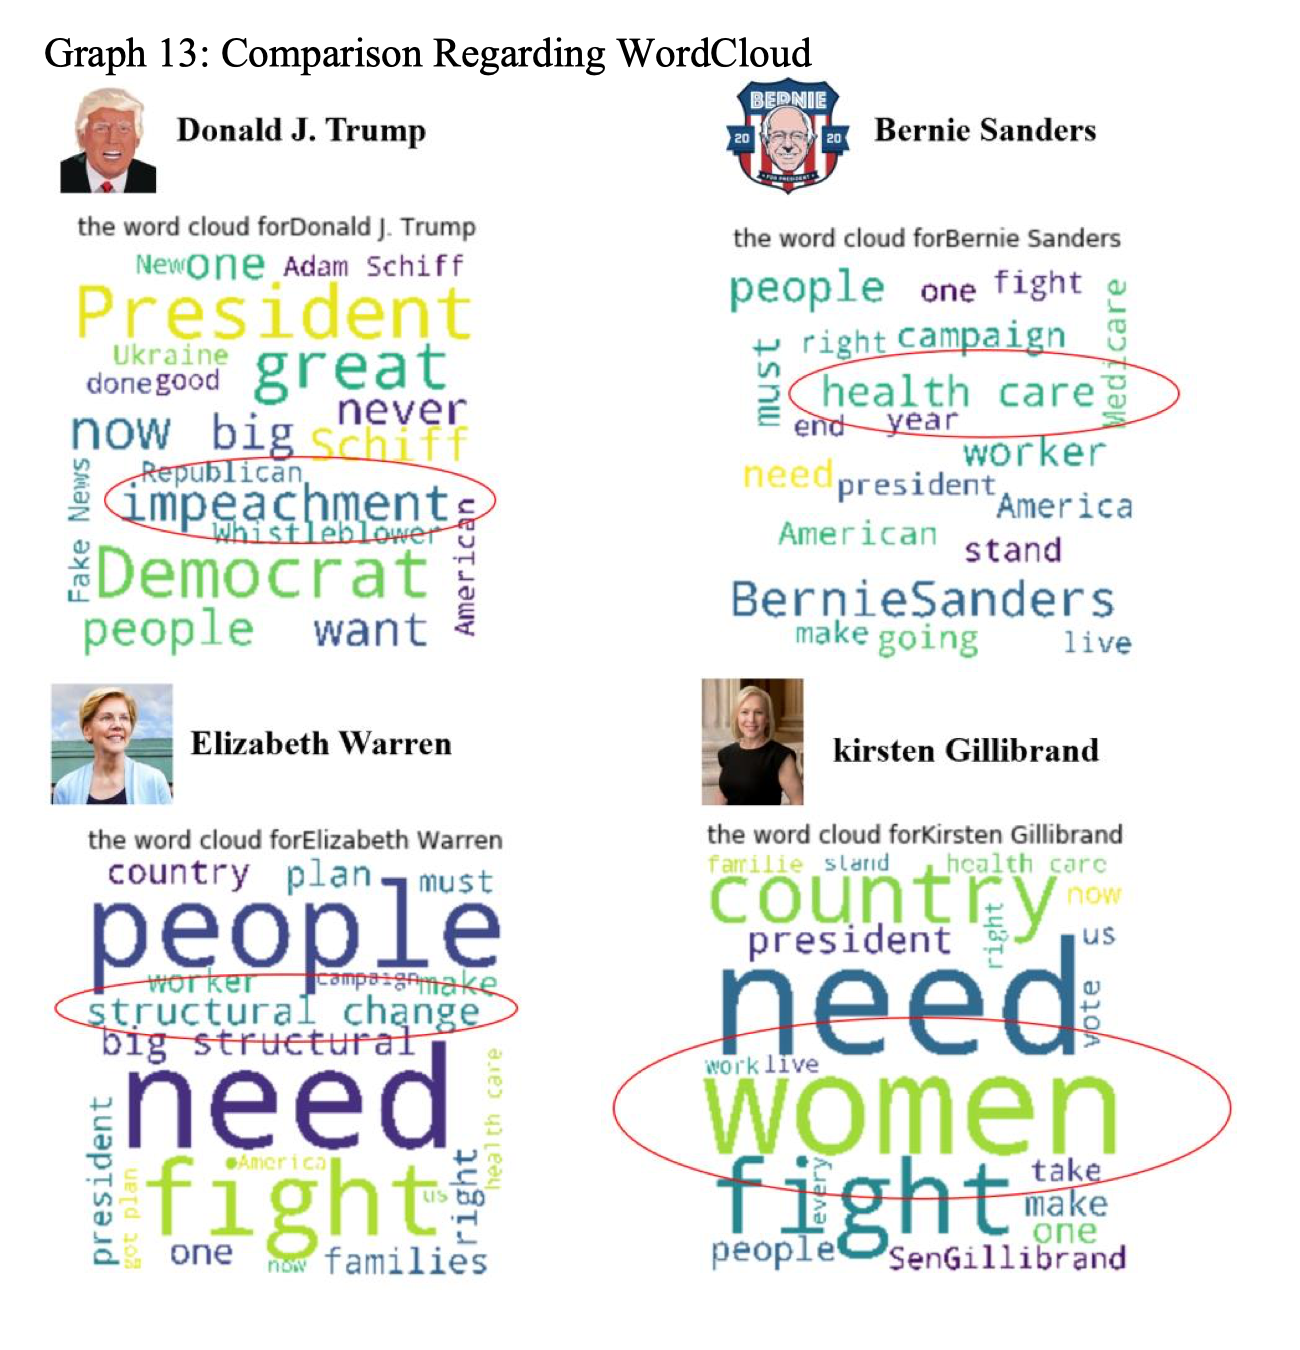
Besides, we created wordcloud of each candidate’s twitter, trying to figure out the main topic of their twitters. We can see that impeachment is a frequent topic for trump, so is Democratic, it seems that he really likes to mention his competitors, probably not to praise them. Moreover, we also find out that most candidates mentioned their political argument very frequently in twitter. The results are demonstrated in Graph 13. For example, Kirsten Gillibrand mentions women a lot. It’s reasonable to deduct that she really cares about women’s right.
So, to summarize, based on demographic features, economic indicators, turnover, previous rate, and so on, we predict Trump would win the 2020 president election. The results from text mining shows that although the attitudes towards Mr. Trump in general are not very positive, he is still considered as the most popular candidate based on data from twitter, which provides him with a large potential in gaining citizens’ attentions as well their votes. This further verifies the prediction result of our models. Congratulations Mr. Trump!